§ Work · iv. · Confidential
Variable-rate prescriptions, grown from data.
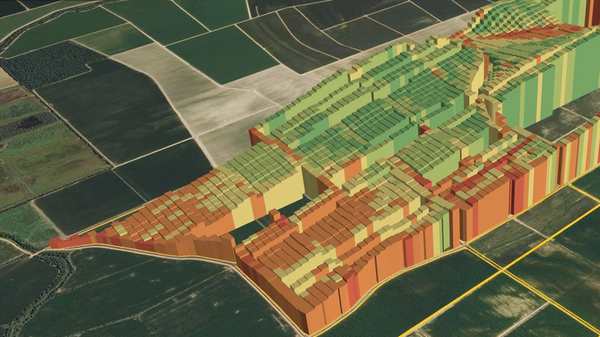
A precision-agriculture platform that turns satellite imagery, soil chemistry, weather history, and equipment telemetry into the maps a sprayer and a planter actually drive against — field by field, season by season.
- Client
- Confidential
- Year
- 2020 – 2021
- Role
- Tech lead, via Lofty Labs
- Outcome
- Inflected the company's commercial trajectory
The pipeline, in four layers
The situation
Variable-rate prescriptions had been a research-grade idea in agriculture for years — the equipment could read a map and vary seed, fertilizer, or chemical application across a field, but the maps that drove them were either crude (split a field into three zones, tweak by gut) or stranded inside a consultant's office. The opportunity was to do it well, repeatably, and in software.
The client wanted to be the company that showed up at the start of a season, took on the data work for an entire farming operation, and handed back prescription maps for every field that the equipment could just drive against. They came to me to build the platform that did it.
What I built
I led the engagement as tech lead through Lofty Labs, working with the client's agronomy team on the model side and a small group of engineers on the platform. The hardest part wasn't training a model. It was the ingestion: getting heterogeneous data — satellite imagery, lab reports as PDFs, weather grids, equipment-vendor exports — reliably tied to the same patch of dirt, season after season, at the scale of an operation that runs to thousands of fields.
The architecture put a Django app and a Vue.js map UI on top of a Postgres / PostGIS spatial core, with the heavy data work running as containerized jobs on Kubernetes against a Python data stack — pandas, xarray, GDAL, the usual suspects. Once the data layer was honest, the prescription side became a tractable modeling problem instead of a heroic per-field consulting effort.
What changed
The platform inflected the company's commercial trajectory. Going into the engagement, prescription work was a high-touch service line. Coming out, it was something the team could deliver at scale — with the data lineage, repeatability, and feedback loops that turn a consulting practice into a product.
Turning a model that works in a notebook into a platform that works for paying customers is its own discipline. If that's where you are, get in touch.
Start a conversation →